On October 20, the House control market had Democrats at 91.5¢ and the Senate market had them at 64.5¢. Behind those two numbers sit dozens of smaller markets: single races, chamber combinations, seat ranges. Read together, they tell you more than any one chart — and they show where a price rests on a thin order book.
How the election itself works is covered in US midterm elections explained. This piece is about what the prices say and how to use them on an account. All figures are as of October 20.
What an outcome price tells you
64.5¢ on “Democrats win the Senate” is the market’s estimate of roughly a 65% chance. If it happens, each share pays $1; if not, zero.
The chart usually shows the midpoint, but trades go through the order book. That day the Senate market’s best ask was 65¢ and its best bid 64¢. You can buy right away at 65¢ and sell right away at 64¢. That 1¢ gap is the spread — what it costs to buy and change your mind a second later.
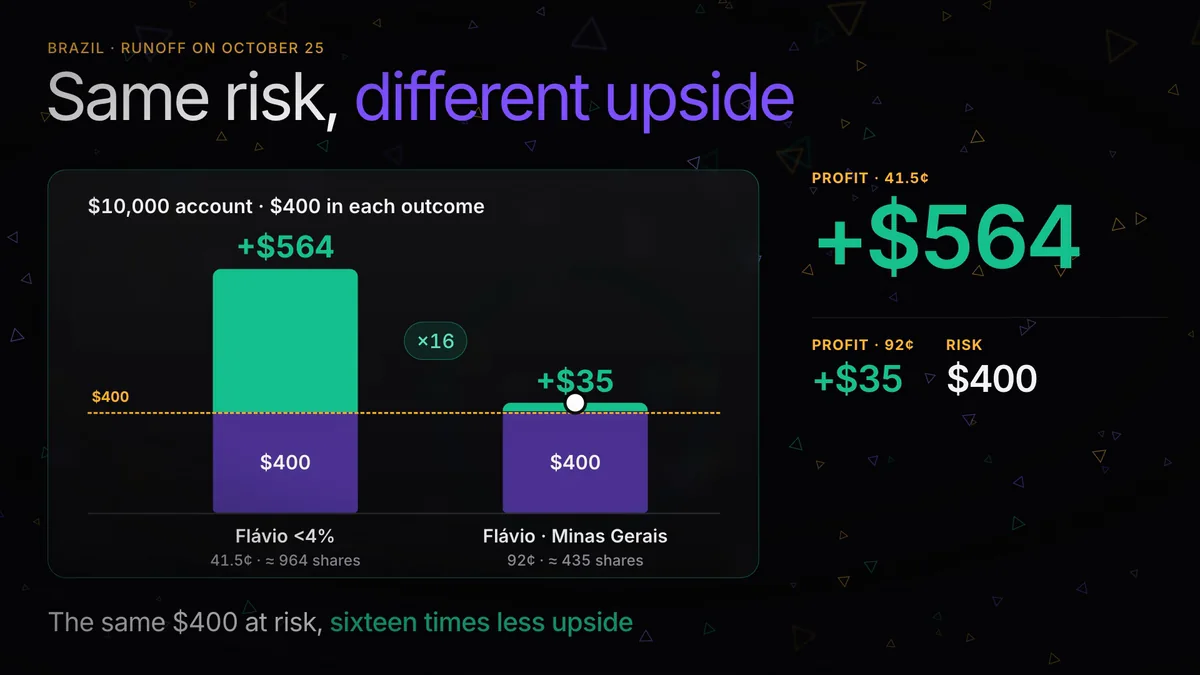
In dollar terms: A $200 position at 65¢ is about 307 shares. If Democrats take the Senate, it pays $307 — roughly $107 profit before fees. The same $200 at 92¢ in the House market is about 217 shares and around $17 of profit. Same risk, very different payoff. Keep that in mind when choosing between a near-settled market and an open one.
Markets on the same event are linked
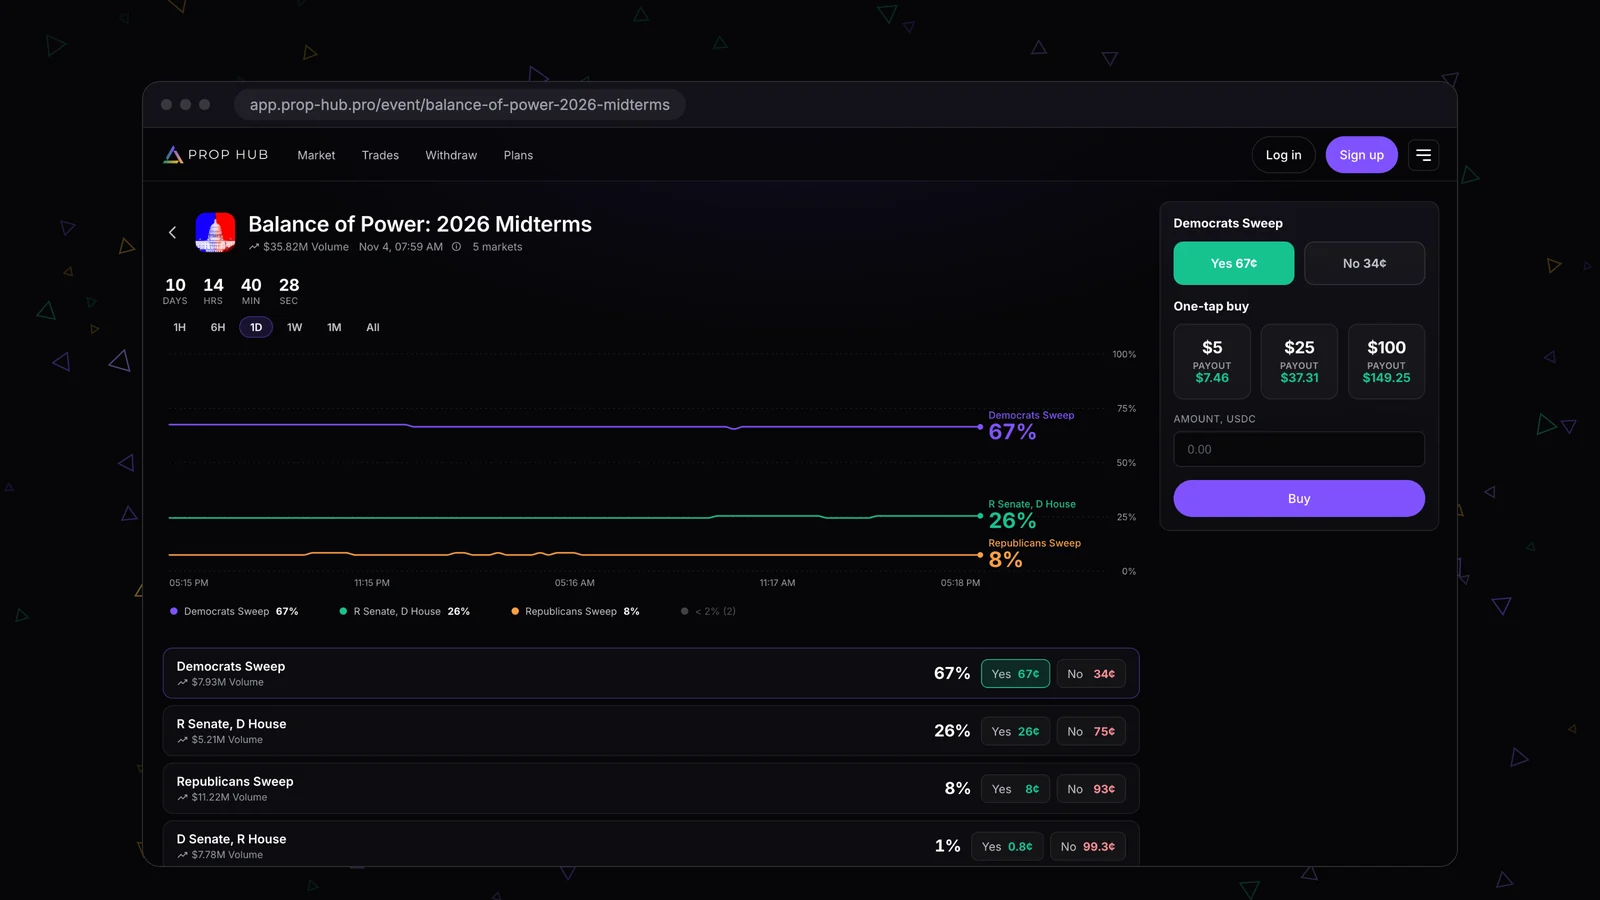
The “Balance of Power” market splits the outcome into four combinations. On October 20:
| Combination | Price |
|---|---|
| Democrats win both chambers | 62.5¢ |
| Democratic House, Republican Senate | 27.5¢ |
| Republicans win both | 8.5¢ |
| Democratic Senate, Republican House | 0.85¢ |
Add up the combinations with a Democratic House: 62.5 + 27.5 = 90¢. The standalone House market says 91.5¢. For the Senate: 62.5 + 0.85 ≈ 63.4¢ against 64.5¢ standalone. A gap of 1–1.5¢ is within spreads and fees. A gap of 5–10¢ would mean one of the prices is off, and it would be worth finding out which.
This check is worth doing before any trade. If the Senate market jumps while Balance of Power doesn’t move, the jump is probably a few large orders in one book rather than new information.
Single races and Senate control
Senate control is built state by state. Democrats need a net gain of four seats, and the race markets show where traders see a path:
- Texas: James Talarico (D) 62.5¢ vs. Ken Paxton (R)
- Maine: Troy Jackson (D) 63.5¢ vs. Susan Collins (R)
- Ohio special: Sherrod Brown (D) 63.5¢ vs. Jon Husted (R)
- Alaska: Mary Peltola (D) 73.5¢ vs. Dan Sullivan (R)
If four races at about 65% each were independent, the chance of taking all four would be around 18%. Yet the Senate market sits at 64.5¢. Two reasons. There are other seats that can complete a majority. And the races are correlated: national mood, turnout and polling error move them together. If election night shows the polls underestimated one party, most of its candidates will outperform at once.
The practical takeaway: “Democrats win the Senate”, “Talarico wins Texas” and “Jackson wins Maine” are essentially one view spread over three markets. On a bad night they fall together.
How the prices moved
The chamber markets have traded since July 2025. Democrats in the Senate opened near 45¢, slid to 28–29¢ by August 2025 and stayed there into the fall. In March 2026 the price climbed past 50¢, eased back to 43–45¢ over the summer, and since late September it has held above 60¢.
The House market was calmer: about 70¢ in summer 2025, a low around 59¢ in October 2025, then an almost steady climb — 77¢ in December, 84¢ in February, 92.5¢ in early October 2026.
None of that means the price “should” keep going. A long-running market absorbs a year of polls, news and sentiment. On Prop Hub you only see the last 2 days before the market’s end date, so what matters is what happens to the price in those days and on counting night — not the history.
Liquidity and spread: when to trust a price
Political markets vary a lot in depth. The House market has traded over $18 million on Polymarket with a 1¢ spread. The Texas Senate race: over $4 million, also 1¢.
Now look at “Which Senate races will be within 5%?” state by state:
| State | Best bid | Best ask | Spread |
|---|---|---|---|
| Maine | 68¢ | 69¢ | 1¢ |
| Michigan | 60¢ | 80¢ | 20¢ |
| Nebraska | 41¢ | 68¢ | 27¢ |
| Minnesota | 39¢ | 69¢ | 30¢ |
Michigan’s 70¢ is just the midpoint between 60 and 80. You can only buy at 80¢ and only sell straight away at 60¢. The position starts 20¢ per share underwater before anything happens.
On Prop Hub a buy walks the order book, best offers first, and fills at the weighted average price. If the book can’t absorb the full amount, the order is rejected — there are no partial fills. That happens often in thin markets. More in the order book and slippage.
Putting it to work on the account
- Cross-check linked markets. House, Senate, Balance of Power and single races should agree within the spread. Where they don’t, look at the book.
- Check the spread before the price. In a market with a 20¢ spread you buy at the top of it, not at the number on the chart.
- Treat linked positions as one. The per-outcome limit is 5% of the starting balance, but three positions on the same party behave like one large one. The drawdown check before each buy already assumes the worst case, where every open position loses.
- Mind the price band. Positions opened above 90¢ or below 10¢ don’t count toward the challenge target or withdrawable profit. Buying a Democratic House at 91.5¢ falls outside it — see funded account payouts.
What these prices do once the votes start coming in is the subject of the piece on election night.